Visualizing the Decline of U.S. Manufacturing, by Sector (2002-2022)
Published
2 days agoon
August 28, 2024Graphics/Design:
미국은 2010년까지 세계 최고의 제조업 국가였지만, 22022년 기준 생산량에서 중국에 2.4조 달러 상당 뒤 쳐졌다
북미 자유 무역협정을 비롯한 무역 자유화와 2001년 중국의 세계 무역 기구 가입과
같은 요인으로 인해 지난 수 십년 동안 미국 산업 기반이 크게 변화 했다
아래 그래픽은 미국 인구 조사국의 데이터를 기반으로 지난 20년 동안
업종별 미국 제조업 기업 수 감소를 보여준다
![]() See this visualization first on the Voronoi app.
See this visualization first on the Voronoi app.
The Decline of U.S. Manufacturing, by Sector
This was originally posted on our Voronoi app. Download the app for free on iOS or Android and discover incredible data-driven charts from a variety of trusted sources.
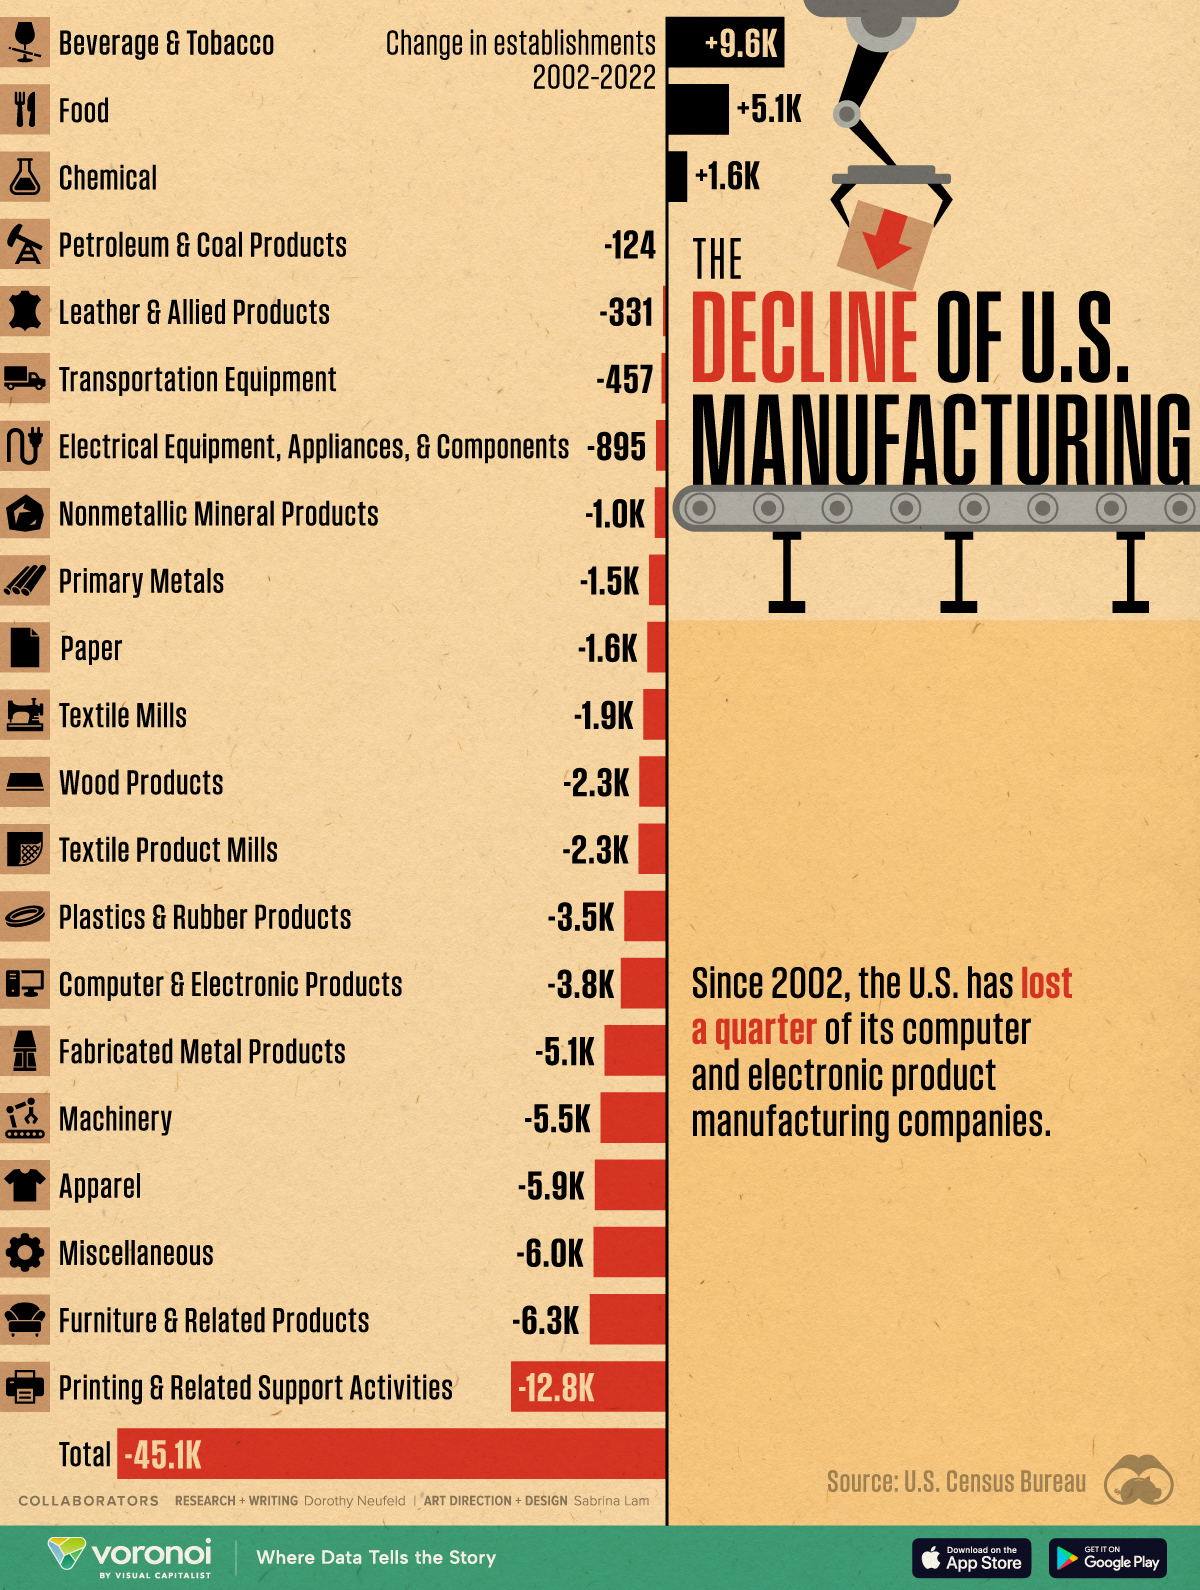
Between 2002 and 2022, the U.S. lost more than 45,000 manufacturing firms amid evolving global trade dynamics.
While the U.S. was the world’s leading manufacturer up to 2010, production has fallen $2.4 trillion behind China as of 2022. Factors such as trade liberalization, including the North American Free Trade Agreement, and China’s accession to the World Trade Organization in 2001, have contributed to a significant shift in the U.S. industrial base over the past few decades.
This graphic shows the decline in the number of manufacturing firms by sector over the last 20 years, based on data from the U.S. Census Bureau.
Shrinking Number of Manufacturing Firms
Below, we show the change in manufacturing firms across each of the 21 sub-sectors:
| Sector | Change in # of Establishments | Change (%) |
|---|---|---|
| Beverage and Tobacco | 9,627 | 351% |
| Food | 5,066 | 20% |
| Chemical | 1,636 | 13% |
| Petroleum and Coal Products | -124 | -6% |
| Leather and Allied Products | -331 | -24% |
| Transportation Equipment | -457 | -4% |
| Electrical Equipment, Appliances, and Components | -895 | -14% |
| Nonmetallic Mineral Products | -1,002 | -6% |
| Primary Metals | -1,472 | -29% |
| Paper | -1,616 | -30% |
| Textile Mills | -1,939 | -52% |
| Wood Products | -2,275 | -14% |
| Textile Product Mills | -2,329 | -31% |
| Plastics and Rubber Products | -3,510 | -23% |
| Computer and Electronic Products | -3,792 | -25% |
| Fabricated Metal Products | -5,128 | -9% |
| Machinery | -5,458 | -20% |
| Apparel | -5,932 | -56% |
| Miscellaneous | -6,027 | -20% |
| Furniture and Related Products | -6,342 | -30% |
| Printing and Related Support Activities | -12,798 | -36% |
| Total | -45,098 | -14% |
Overall, the number of U.S. manufacturing firms has shrunk by 14% over 20 years, with 50% or higher drops in the apparel and textile mills sectors.
Amid factory closures across nearly all manufacturing sectors, employment has dropped to 13 million workers as of January 2023, down from its 1979 peak of 19.5 million workers. Today, manufacturing jobs make up roughly 10% of the U.S. private sector workforce.
While manufacturing productivity growth excelled during the 1990s and 2000s, it has lagged over the last decade. Over a third of this slowdown was due to the computer and electronics sector, which was a major driver of productivity growth in previous decades, particularly in semiconductor chips. Since 2002, the number of computer and electronic manufacturing firms has decreased by a quarter.
Similarly, other durable manufacturing sectors like machinery and primary metals (such as steel and aluminum), saw double-digit declines in the number of firms. Despite these closures, U.S. durable goods exports hit a record $1 trillion in 2023, accounting for 63% of all manufacturing exports.
By contrast, beverages and tobacco is one of three sectors with positive growth, driven by the boom in seltzer waters, kombuchas, craft breweries, and craft cocktails. Since 2002, the number of firms has jumped by 351%, adding 9,627 establishments in total.
댓글 없음:
댓글 쓰기